

 English
 日本語
日本語
 한국어
한국어
 简体中文
简体中文
 繁體中文
繁體中文
 Italiano
 español
 Deutsch

Подробности урока
1. Presentation (8–10 minutes)
🎯 Lesson Goal
Students will learn how to describe and analyse charts in business contexts — meetings, reports, and presentations.
🧠 Lead-in (2–3 minutes)
Show a simple chart (e.g., sales growth over 4 quarters).
Ask:

“What do you see in this chart?”
-
“Is the trend going up or down?”
-
“What do you think caused the change?”
Introduce key terms:
📈 increase, rise, grow, go up
📉 decrease, fall, drop, go down
➡️ remain stable, stay the same, fluctuate
🗣️ Model Sentences (5 minutes)
✅ Tips:
-
Use adverbs to show size of change: slightly, gradually, sharply, dramatically.
-
Use prepositions correctly: increase in sales, rise by 10%, fall to 200 units.
🧩 2. Practice (10 minutes)
🗂️ Controlled Practice (5 minutes)
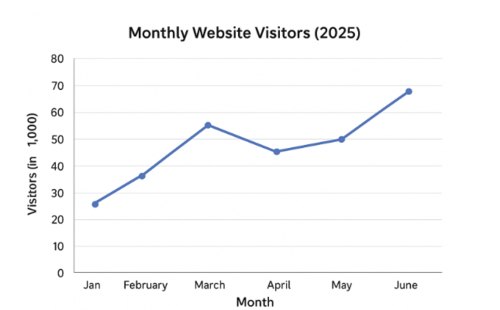
Show a simple line chart (e.g., monthly website visitors).
Give short prompts and ask students to complete sentences:
-
Website traffic ______ from January to March. (increased steadily)
-
It ______ in April. (fell sharply)
-
From May to June, it ______. (remained stable)
Drill pronunciation of key words (e.g., increased, decreased, remained).
📊 Guided Speaking Practice (5 minutes)
Show a bar chart (e.g., product sales for A, B, C).
Ask students:
-
“Which product sold the most?”
-
“Which one showed a decrease?”
-
“What’s your conclusion?”
Model example:
“Product A sales rose sharply, while Product B sales dropped slightly. Overall, total sales increased.”
💬 3. Production (7–8 minutes)
🎤 Task: Mini Presentation
Students work individually or in pairs.
Instructions:
-
Choose one chart (teacher provides 2–3 simple options).
-
Prepare a short (1–2 minute) talk describing it.
-
Use at least 3 target phrases (increase, decrease, stable, etc.).
Example:
“This chart shows company profits from January to June.
Profits increased slightly in February and rose sharply in March.
However, there was a big drop in April before recovering in May.”
Teacher gives light feedback on pronunciation, structure, and accuracy.
🧠 4. Wrap-Up (2–3 minutes)
Ask:
-
“What words can we use to show an increase or decrease?”
-
“What adverbs describe how much change there is?”
-
“Why is it important to describe data clearly in business?”
✅ Homework (optional):
Find a simple chart online and write a short paragraph describing it using 5 of today’s phrases.
🧾 Key Vocabulary List
Порядок отмены урока Cafetalk
Перед подтверждением запроса
- Вы можете отменить в любое время.
После подтверждения запроса
- Больше, чем за 24 часа до начала урока→ Вы можете отменить в любое время.
- За 24 часа до начала урока→ Возможна комиссия за отмену урока.
-
No-Show→ Возможна комиссия за отмену урока.
(первым делом свяжитесь с преподавателем, поскольку размер комиссии зависит от него.)
Все уроки данного преподавателя
-

Learning English Through Western Music
Learning English Through SongsEnglish 35min 1,300PЕсть пробный урок
-
-
-
-
-
-

Learning English with a Recommended Textbook
Student Requested TopicEnglish
25min 1,700PЕсть пробный урок
-

Learning English Independently
Using personal electronic devices (e.g. mobile phone, ipad, laptop, pc, etc)English
25min 1,700PЕсть пробный урок
-
-

Vocabulary
words related to your job (martial art instructor)English
25min 1,200PЕсть пробный урок
-
-


