

 English
 日本語
日本語
 한국어
한국어
 简体中文
简体中文
 繁體中文
繁體中文
 Italiano
 español
 Русский

IELTS writing task 1 - bar chart : writing exercises for students
Kursinhalt
IELTS writing task 1 : bar graph examplar
Students are introduced to the question .
The teacher shows students the correct structure for the task ; the basic sections for IELTS writing are as follows : introduction , main body , conclusion .
The teacher begins by asking students to read the question .
The teacher gives ideas on how the student could structure the opening sentences of each section . For example :
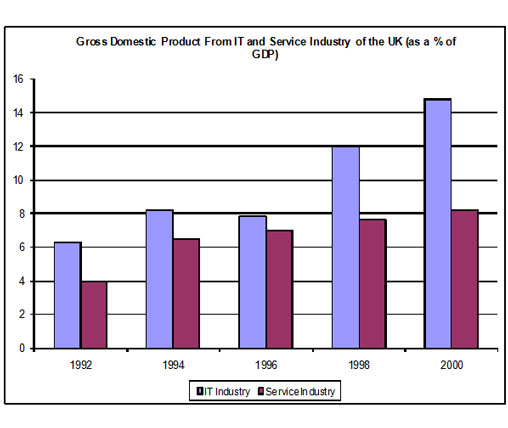
The introduction could be written as follows : In the following essay there will be an analysis of the bar graph describing the Gross domestic Product for UK for the industries I.T. and service sectors . The vetical axis is the precentage of GDP while the horizontal axis shows the how the sectors have changes over a number of years .
The main body of the essay describes the important changes in percentages for these two sectors . The teacher will ask students to give their opinions on what are the significant changes to these sectors and how to correctly describe them using such terms as " increases over time ," " there is a slight reduction from ... to ... " (or) the ... industry has remained constant over the period."
The teacher introduces the conclusion section and students are shown how to write appropriate sentences . for the conclusion there is a restatement of the main idea and also any important conclusions that are indicated from the graph.
Students are introduced to the question .
The teacher shows students the correct structure for the task ; the basic sections for IELTS writing are as follows : introduction , main body , conclusion .
The teacher begins by asking students to read the question .
The teacher gives ideas on how the student could structure the opening sentences of each section . For example :
The introduction could be written as follows : In the following essay there will be an analysis of the bar graph describing the Gross domestic Product for UK for the industries I.T. and service sectors . The vetical axis is the precentage of GDP while the horizontal axis shows the how the sectors have changes over a number of years .
The main body of the essay describes the important changes in percentages for these two sectors . The teacher will ask students to give their opinions on what are the significant changes to these sectors and how to correctly describe them using such terms as " increases over time ," " there is a slight reduction from ... to ... " (or) the ... industry has remained constant over the period."
The teacher introduces the conclusion section and students are shown how to write appropriate sentences . for the conclusion there is a restatement of the main idea and also any important conclusions that are indicated from the graph.
Cafetalk Rücktrittsregelung
Vor der Bestätigung einer Kursbuchung
- Stornierung jederzeit möglich
Nach der Bestätigung einer Kursbuchung
- Mehr als 24 Stunden vor Kursbeginn→ Stornierung jederzeit möglich
- Weniger als 24 Stunden vor Kursbeginn→ Stornogebühren können anfallen.
-
No-Show→ Stornogebühren können anfallen.
(Der Betrag kann je nach TutorIn variieren. Bitte nimm Kontakt mit Deiner Tutorin/ Deinem Tutor auf.)
Alle Kurse von dieser/m TutorIn
-

Test preparation - EIKEN
Going through the stages of doing a Pre-1 level speaking test .Others (Academic Tutoring) 25 Min. 2,500P
 -
-

Textbook lesson : Let's Go - Introduction
Introduction - elementary students , week one , Level 2 - Yellow book (4th edition) low intermediate , high beginner -age 5-8Primary School
25 Min. 2,000P -

Let's Go textbook lesson
Introduction - week one ; Blue book , Level 3 (4th edition) ( high intermediate level - age 8-11)English
25 Min. 2,600P -

Introduction lesson
Introductory lesson for elementary /Junior High school students (aged 7 ー 12 )Primary School
25 Min. 2,500P -

Discussion ー My favorite Place
Presentation for students to talk about their favorite place in JapanLifestyle
25 Min. 2,600P -

English topic discussion
Discuss the following:‘Students be allowed to use cellphones in class .Do you agree or disagree?’Others (Academic Tutoring)
30 Min. 2,600P
